Jemalloc Heap Profiling
This topic describes how to enable and visualize the Jemalloc Heap Profile for StarRocks.
- Enabling Jemalloc Heap Profiling may have an impact on StarRocks' performance.
- This solution is available only for StarRocks v3.1.6 and later.
Enable Jemalloc Heap Profile
Syntax:
ADMIN EXECUTE ON <be_id> 'System.print(HeapProf.getInstance().enable_prof())'
Enabling requires the BE to have been started with prof:true in jemalloc_conf, which is the default; otherwise the statement fails. The current setting is also visible in information_schema.be_configs: query the row whose NAME is jemalloc_conf and read the prof_active option inside its VALUE.
be_id: The ID of BE/CN node. You can get the ID by running SHOW BACKENDS or SHOW COMPUTE NODES.
Example:
mysql> admin execute on 10001 'System.print(HeapProf.getInstance().enable_prof())';
+--------+
| result |
+--------+
| OK     |
+--------+
1 row in set (0.00 sec)
You can check whether Jemalloc Heap Profile is enabled or not by using the following syntax:
ADMIN EXECUTE ON <be_id> 'System.print(HeapProf.getInstance().has_enable())'
Example:
mysql> admin execute on 10001 'System.print(HeapProf.getInstance().has_enable())';
+--------+
| result |
+--------+
| true   |
+--------+
1 row in set (0.01 sec)
You can disable Jemalloc Heap Profile by using the following syntax:
ADMIN EXECUTE ON <be_id> 'System.print(HeapProf.getInstance().disable_prof())'
Example:
mysql> admin execute on 10001 'System.print(HeapProf.getInstance().disable_prof())';
+--------+
| result |
+--------+
| OK     |
+--------+
1 row in set (0.00 sec)
Collect Jemalloc Heap Profile
Syntax:
ADMIN EXECUTE ON <be_id> 'System.print(HeapProf.getInstance().dump_dot_snapshot())'
Example:
mysql> admin execute on 10001 'System.print(HeapProf.getInstance().dump_dot_snapshot())';
+-----------------------------------------------------------------------------------------------------------------------------------------------------------------------------------------------------------------+
| result                                                                                                                                                                                                          |
+-----------------------------------------------------------------------------------------------------------------------------------------------------------------------------------------------------------------+
| digraph "/home/disk/opt/env/default/be/lib/starrocks_be; 1.0 MB" {                                                                                                                                         |
| node [width=0.375,height=0.25];                                                                                                                                                                                 |
| Legend [shape=box,fontsize=24,shape=plaintext,label="/home/disk/opt/env/default/be/lib/starrocks_be\lTotal MB: 1.0\lFocusing on: 1.0\lDropped nodes with <= 0.0 abs(MB)\lDropped edges with <= 0.0 MB\l"]; |
| N1 [label="brpc\nInputMessenger\nOnNewMessages\n0.0 (0.0%)\rof 1.0 (100.0%)\r",shape=box,fontsize=8.0];                                                                                                         |
| N2 [label="brpc\nSocket\nProcessEvent\n0.0 (0.0%)\rof 1.0 (100.0%)\r",shape=box,fontsize=8.0];                                                                                                                  |
| N3 [label="bthread\nTaskGroup\ntask_runner\n0.0 (0.0%)\rof 1.0 (100.0%)\r",shape=box,fontsize=8.0];                                                                                                             |
| N4 [label="bthread_make_fcontext\n0.0 (0.0%)\rof 1.0 (100.0%)\r",shape=box,fontsize=8.0];                                                                                                                       |
| N5 [label="brpc\nInputMessenger\nCutInputMessage\n0.0 (0.0%)\rof 0.5 (50.1%)\r",shape=box,fontsize=8.0];                                                                                                        |
| N6 [label="brpc\npolicy\nParseRpcMessage\n0.5 (50.1%)\r",shape=box,fontsize=43.4];                                                                                                                              |
| N7 [label="brpc\nProcessInputMessage\n0.0 (0.0%)\rof 0.5 (49.9%)\r",shape=box,fontsize=8.0];                                                                                                                    |
| N8 [label="brpc\npolicy\nProcessRpcRequest\n0.0 (0.0%)\rof 0.5 (49.9%)\r",shape=box,fontsize=8.0];                                                                                                              |
| N9 [label="starrocks\nPInternalServiceImplBase\nexecute_command\n0.0 (0.0%)\rof 0.5 (49.9%)\r",shape=box,fontsize=8.0];                                                                                         |
| N10 [label="starrocks\nStorageEngineRef\nbind\n0.0 (0.0%)\rof 0.5 (49.9%)\r",shape=box,fontsize=8.0];                                                                                                           |
| N11 [label="starrocks\nexecute_command\n0.0 (0.0%)\rof 0.5 (49.9%)\r",shape=box,fontsize=8.0];                                                                                                                  |
| N12 [label="starrocks\nexecute_script\n0.0 (0.0%)\rof 0.5 (49.9%)\r",shape=box,fontsize=8.0];                                                                                                                   |
| N13 [label="std\nmake_unique\n0.5 (49.9%)\r",shape=box,fontsize=43.3];                                                                                                                                          |
| N2 -> N1 [label=1.0, weight=16398, style="setlinewidth(2.000000)"];                                                                                                                                             |
| N3 -> N2 [label=1.0, weight=16398, style="setlinewidth(2.000000)"];                                                                                                                                             |
| N4 -> N3 [label=1.0, weight=16398, style="setlinewidth(2.000000)"];                                                                                                                                             |
| N1 -> N5 [label=0.5, weight=10102, style="setlinewidth(2.000000)"];                                                                                                                                             |
| N5 -> N6 [label=0.5, weight=10102, style="setlinewidth(2.000000)"];                                                                                                                                             |
| N9 -> N11 [label=0.5, weight=10086, style="setlinewidth(2.000000)"];                                                                                                                                            |
| N12 -> N10 [label=0.5, weight=10086, style="setlinewidth(2.000000)"];                                                                                                                                           |
| N11 -> N12 [label=0.5, weight=10086, style="setlinewidth(2.000000)"];                                                                                                                                           |
| N1 -> N7 [label=0.5, weight=10086, style="setlinewidth(2.000000)"];                                                                                                                                             |
| N7 -> N8 [label=0.5, weight=10086, style="setlinewidth(2.000000)"];                                                                                                                                             |
| N10 -> N13 [label=0.5, weight=10086, style="setlinewidth(2.000000)"];                                                                                                                                           |
| N8 -> N9 [label=0.5, weight=10086, style="setlinewidth(2.000000)"];                                                                                                                                             |
| }                                                                                                                                                                                                               |
+-----------------------------------------------------------------------------------------------------------------------------------------------------------------------------------------------------------------+
29 rows in set (30.22 sec)
Visualize Jemalloc Heap Profile
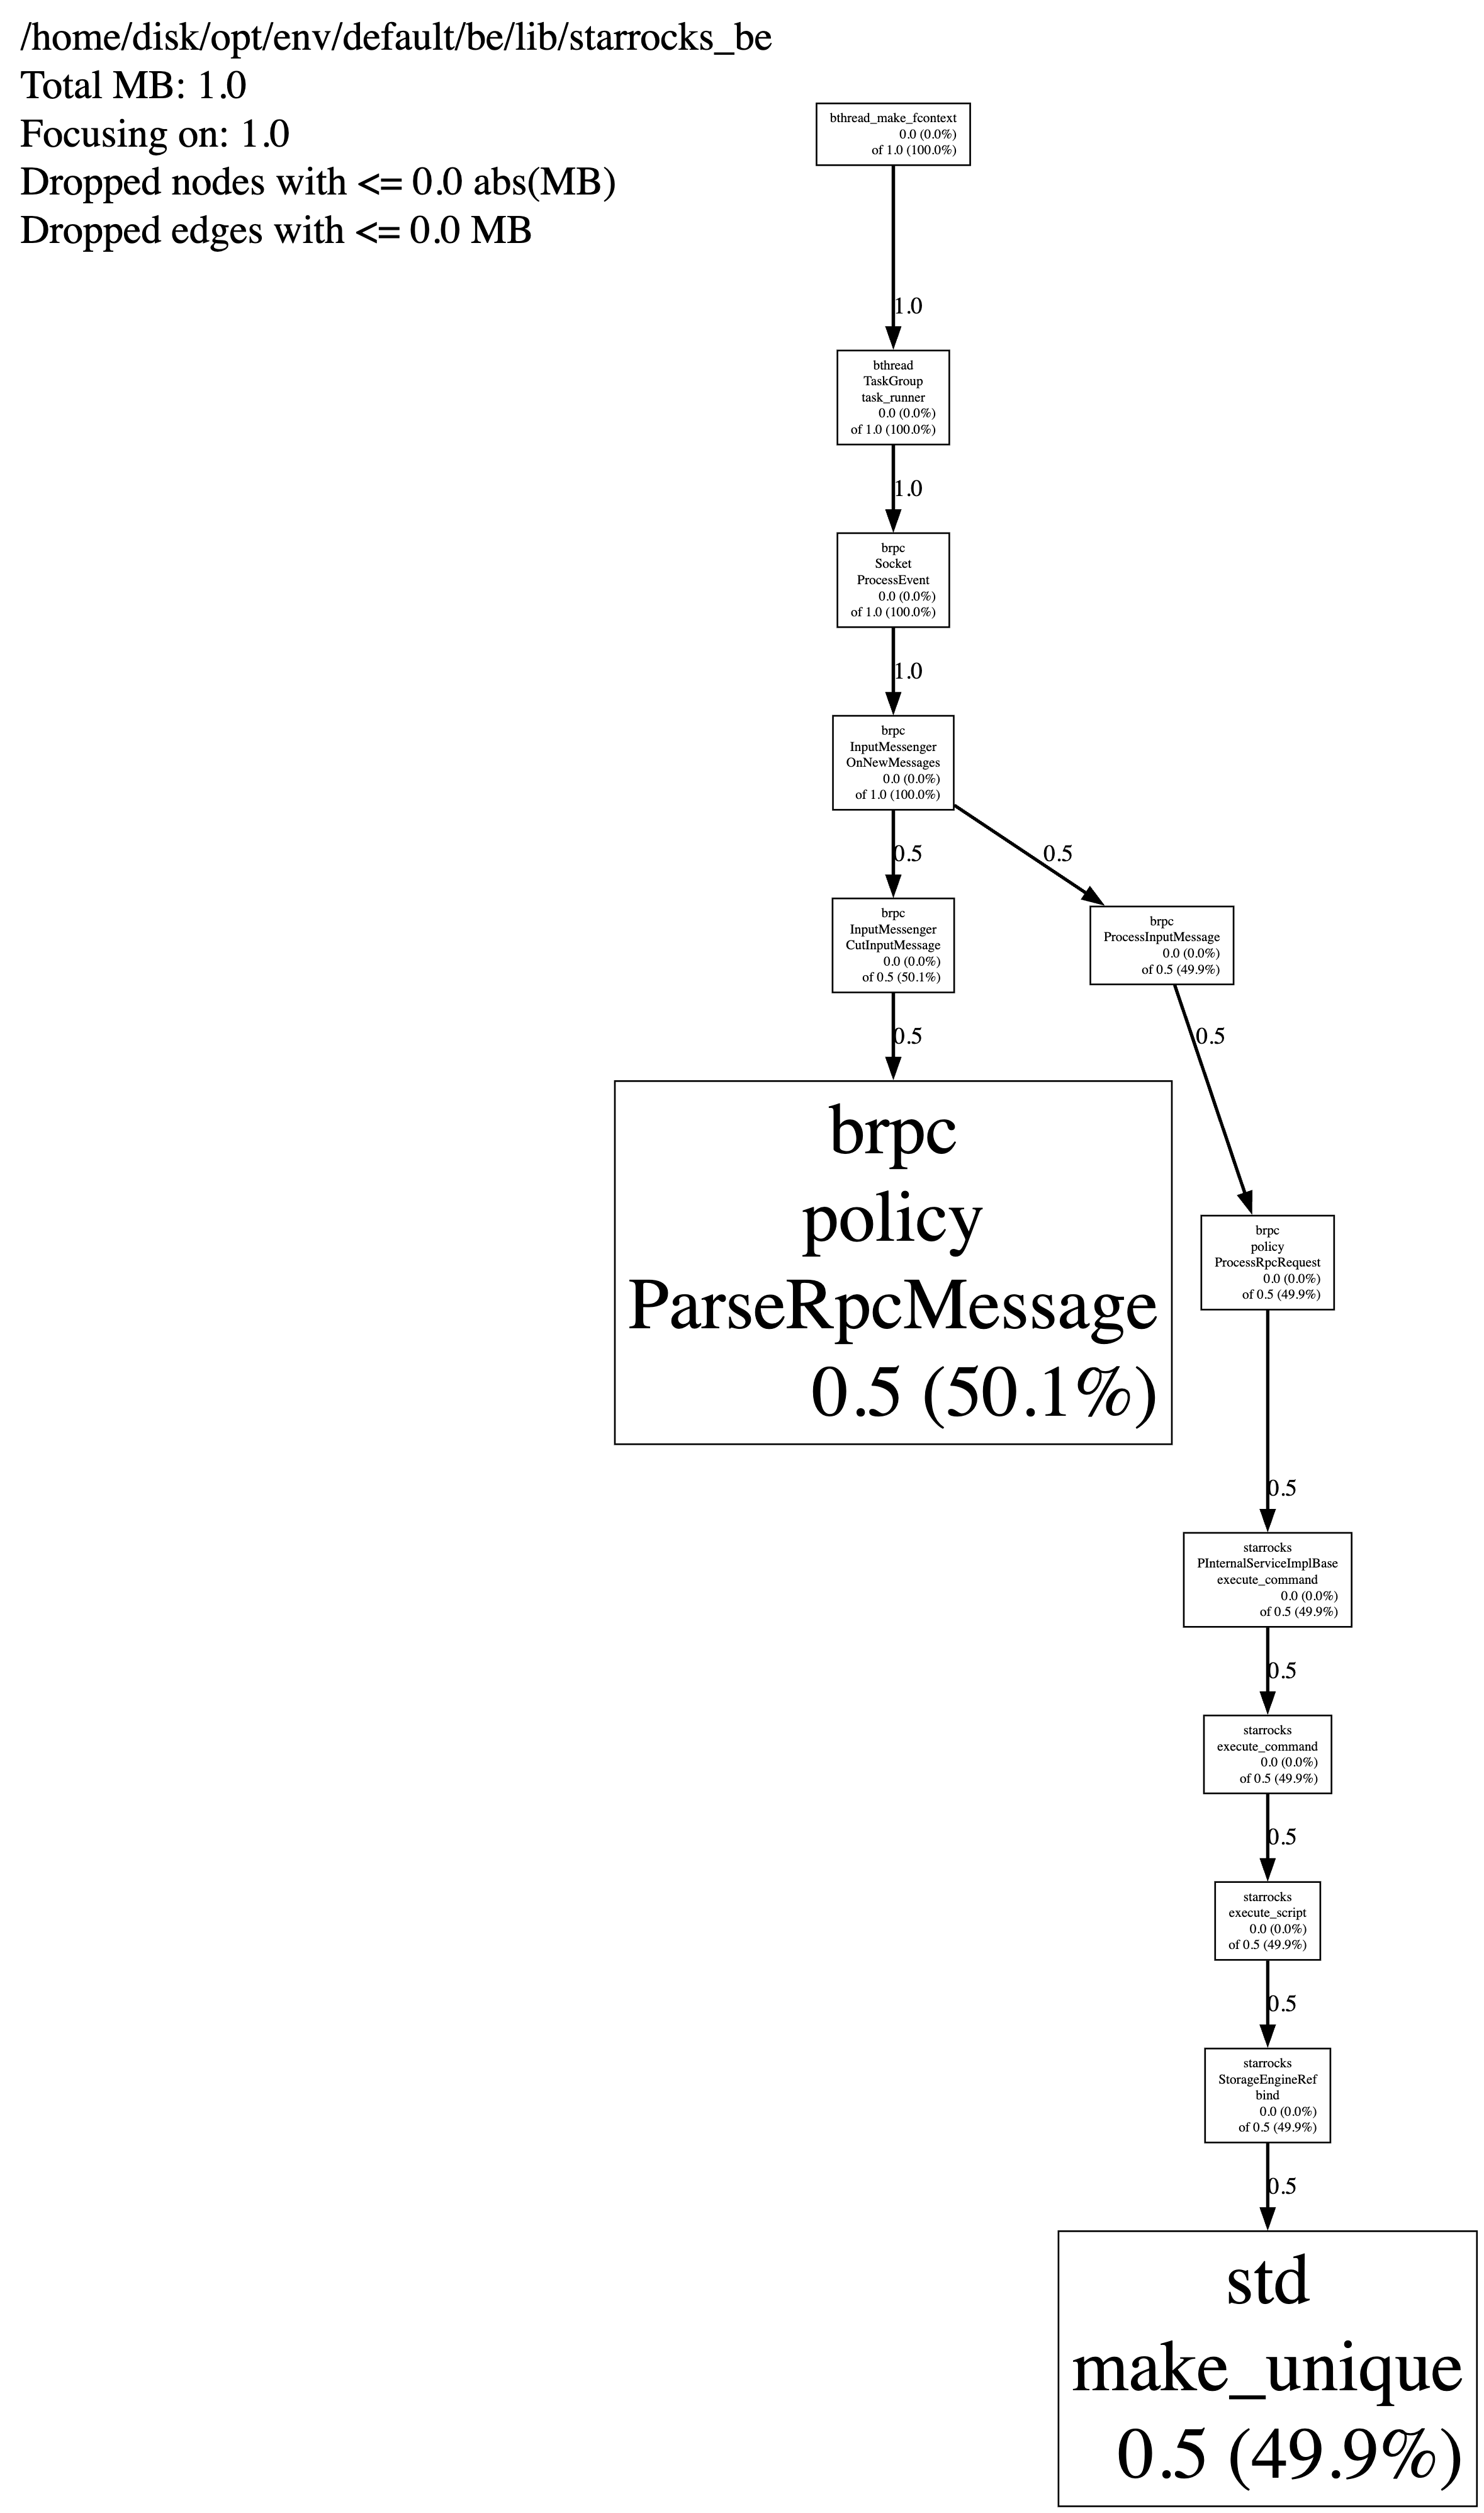
Copy the profile text you collected in the last step, and paste it to GraphvizOnline.
You can then download the visualized Heap Profile.
Example: