Query Profile Metrics
Authoritative reference for raw metrics emitted by StarRocks Query Profile, grouped by operator.
Use it as a glossary; for troubleshooting guidance jump to query_profile_tuning_recipes.md.
Summary Metrics
Basic information about the query execution:
| Metric | Description |
|---|---|
| Total | The total time consumed by the query, including Planning, Executing, and Profiling phase durations. |
| Query State | Query state, possible states include Finished, Error, and Running. |
| Query ID | Unique identifier for the query. |
| Start Time | Timestamp when the query started. |
| End Time | Timestamp when the query ended. |
| Total | Total duration of the query. |
| Query Type | Type of the query. |
| Query State | Current state of the query. |
| StarRocks Version | Version of StarRocks used. |
| User | User who executed the query. |
| Default Db | Default database used for the query. |
| Sql Statement | SQL statement executed. |
| Variables | Important variables used for the query. |
| NonDefaultSessionVariables | Non-default session variables used for the query. |
| Collect Profile Time | Time taken to collect the profile. |
| IsProfileAsync | Indicates if the profile collection was asynchronous. |
Planner Metrics
It provides a comprehensive overview of the planner. Typically, if the total time spent on the planner is less than 10ms, it is not a cause for concern.
In certain scenarios, the planner may require more time:
- Complex queries may necessitate additional time for parsing and optimization to ensure an optimal execution plan.
- The presence of numerous materialized views can increase the time required for query rewriting.
- When multiple concurrent queries exhaust system resources and the query queue is utilized, the
Pendingtime may be prolonged. - Queries involving external tables may incur additional time for communication with the external metadata server.
Example:
     - -- Parser[1] 0
     - -- Total[1] 3ms
     -     -- Analyzer[1] 0
     -         -- Lock[1] 0
     -         -- AnalyzeDatabase[1] 0
     -         -- AnalyzeTemporaryTable[1] 0
     -         -- AnalyzeTable[1] 0
     -     -- Transformer[1] 0
     -     -- Optimizer[1] 1ms
     -         -- MVPreprocess[1] 0
     -         -- MVTextRewrite[1] 0
     -         -- RuleBaseOptimize[1] 0
     -         -- CostBaseOptimize[1] 0
     -         -- PhysicalRewrite[1] 0
     -         -- DynamicRewrite[1] 0
     -         -- PlanValidate[1] 0
     -             -- InputDependenciesChecker[1] 0
     -             -- TypeChecker[1] 0
     -             -- CTEUniqueChecker[1] 0
     -             -- ColumnReuseChecker[1] 0
     -     -- ExecPlanBuild[1] 0
     - -- Pending[1] 0
     - -- Prepare[1] 0
     - -- Deploy[1] 2ms
     -     -- DeployLockInternalTime[1] 2ms
     -         -- DeploySerializeConcurrencyTime[2] 0
     -         -- DeployStageByStageTime[6] 0
     -         -- DeployWaitTime[6] 1ms
     -             -- DeployAsyncSendTime[2] 0
     - DeployDataSize: 10916
    Reason:
Execution Overview Metrics
High-level execution statistics:
| Metric | Description | Rule of Thumb |
|---|---|---|
| FrontendProfileMergeTime | FE-side profile processing time | < 10ms normal |
| QueryAllocatedMemoryUsage | Total allocated memory across nodes | |
| QueryDeallocatedMemoryUsage | Total deallocated memory across nodes | |
| QueryPeakMemoryUsagePerNode | Maximum peak memory per node | < 80% capacity normal |
| QuerySumMemoryUsage | Total peak memory across nodes | |
| QueryExecutionWallTime | Wall time of execution | |
| QueryCumulativeCpuTime | Total CPU time across nodes | Compare with walltime * totalCpuCores |
| QueryCumulativeOperatorTime | Total operator execution time | Denominator for operator time percentages |
| QueryCumulativeNetworkTime | Total Exchange node network time | |
| QueryCumulativeScanTime | Total Scan node IO time | |
| QueryPeakScheduleTime | Maximum Pipeline ScheduleTime | < 1s normal for simple queries |
| QuerySpillBytes | Data spilled to disk | < 1GB normal |
Fragment Metrics
Fragment-level execution details:
| Metric | Description |
|---|---|
| InstanceNum | Number of FragmentInstances |
| InstanceIds | IDs of all FragmentInstances |
| BackendNum | Number of participating BEs |
| BackendAddresses | BE addresses |
| FragmentInstancePrepareTime | Fragment Prepare phase duration |
| InstanceAllocatedMemoryUsage | Total allocated memory for instances |
| InstanceDeallocatedMemoryUsage | Total deallocated memory for instances |
| InstancePeakMemoryUsage | Peak memory across instances |
Pipeline Metrics
Pipeline execution details and relationships:
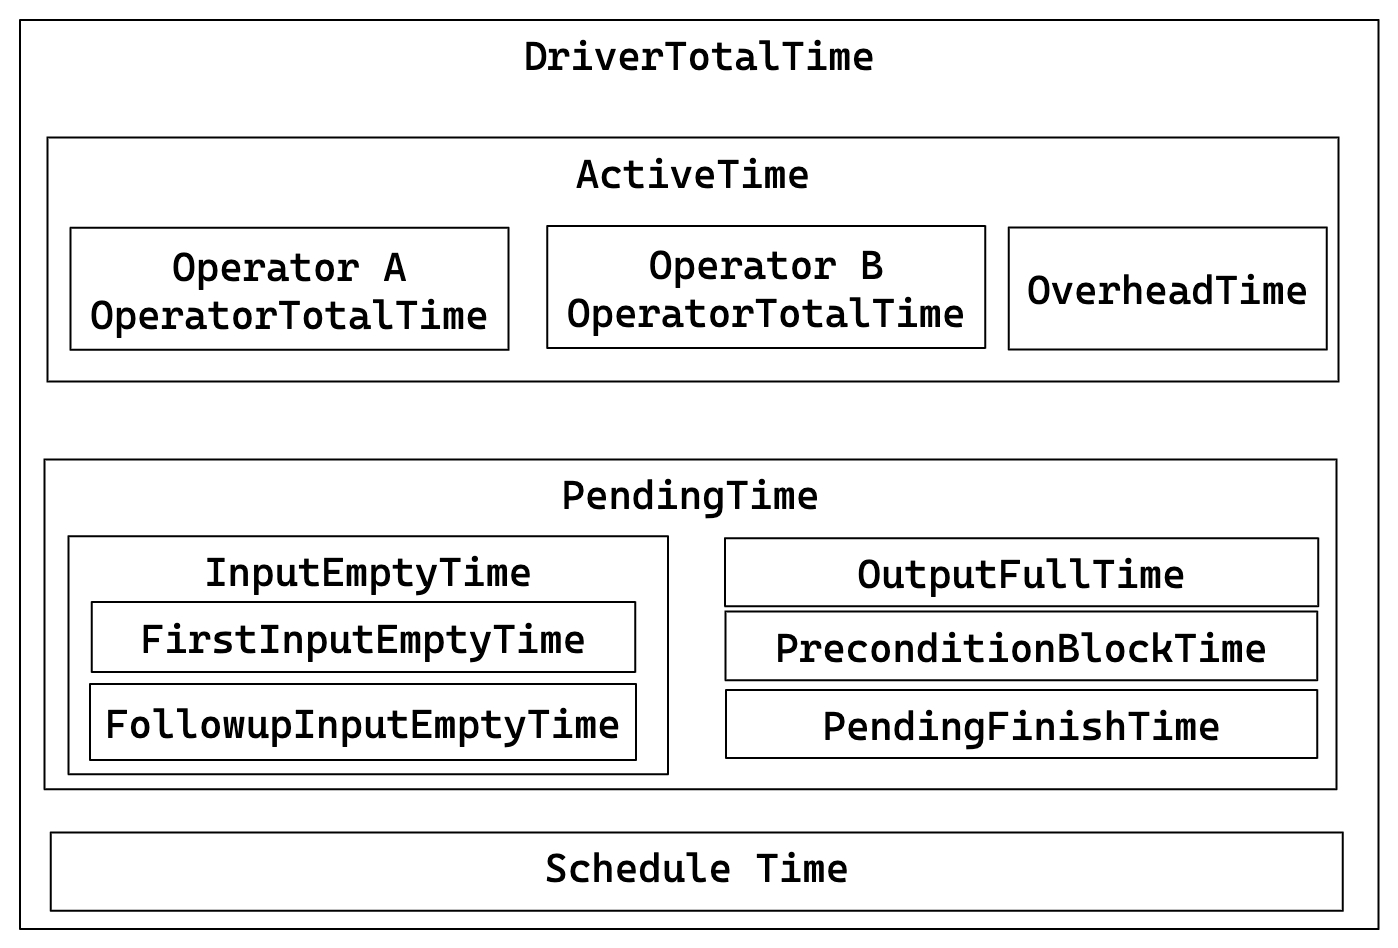
Key relationships:
- DriverTotalTime = ActiveTime + PendingTime + ScheduleTime
- ActiveTime = ∑ OperatorTotalTime + OverheadTime
- PendingTime = InputEmptyTime + OutputFullTime + PreconditionBlockTime + PendingFinishTime
- InputEmptyTime = FirstInputEmptyTime + FollowupInputEmptyTime
| Metric | Description |
|---|---|
| DegreeOfParallelism | Degree of pipeline execution parallelism. |
| TotalDegreeOfParallelism | Sum of degrees of parallelism. Since the same Pipeline may execute on multiple machines, this item aggregates all values. |
| DriverPrepareTime | Time taken by the Prepare phase. This metric is not included in DriverTotalTime. |
| DriverTotalTime | Total execution time of the Pipeline, excluding the time spent in the Prepare phase. |
| ActiveTime | Execution time of the Pipeline, including the execution time of each operator and the overall framework overhead, such as time spent in invoking methods like has_output, need_input, etc. |
| PendingTime | Time the Pipeline is blocked from being scheduled for various reasons. |
| InputEmptyTime | Time the Pipeline is blocked due to an empty input queue. |
| FirstInputEmptyTime | Time the Pipeline is first blocked due to an empty input queue. The first blocking time is separately calculated because the first blocking is mainly caused by Pipeline dependencies. |
| FollowupInputEmptyTime | Time the Pipeline is subsequently blocked due to an empty input queue. |
| OutputFullTime | Time the Pipeline is blocked due to a full output queue. |
| PreconditionBlockTime | Time the Pipeline is blocked due to unmet dependencies. |
| PendingFinishTime | Time the Pipeline is blocked waiting for asynchronous tasks to finish. |
| ScheduleTime | Scheduling time of the Pipeline, from entering the ready queue to being scheduled for execution. |
| BlockByInputEmpty | Number of times the pipeline is blocked due to InputEmpty. |
| BlockByOutputFull | Number of times the pipeline is blocked due to OutputFull. |
| BlockByPrecondition | Number of times the pipeline is blocked due to unmet preconditions. |
Operator Metrics
| Metric | Description |
|---|---|
| PrepareTime | Time spent on preparation. |
| OperatorTotalTime | Total time consumed by the Operator. It satisfies the equation: OperatorTotalTime = PullTotalTime + PushTotalTime + SetFinishingTime + SetFinishedTime + CloseTime. It excludes time spent on preparation. |
| PullTotalTime | Total time the Operator spends executing push_chunk. |
| PushTotalTime | Total time the Operator spends executing pull_chunk. |
| SetFinishingTime | Total time the Operator spends executing set_finishing. |
| SetFinishedTime | Total time the Operator spends executing set_finished. |
| PushRowNum | Cumulative number of input rows for the Operator. |
| PullRowNum | Cumulative number of output rows for the Operator. |
| JoinRuntimeFilterEvaluate | Number of times Join Runtime Filter is evaluated. |
| JoinRuntimeFilterHashTime | Time spent computing hash for Join Runtime Filter. |
| JoinRuntimeFilterInputRows | Number of input rows for Join Runtime Filter. |
| JoinRuntimeFilterOutputRows | Number of output rows for Join Runtime Filter. |
| JoinRuntimeFilterTime | Time spent on Join Runtime Filter. |
Scan Operator
OLAP Scan Operator
The OLAP_SCAN Operator is responsible for reading data from StarRocks native tables.
| Metric | Description |
|---|---|
| Table | Table name. |
| Rollup | Materialized view name. If no materialized view is hit, it is equivalent to the table name. |
| SharedScan | Whether the enable_shared_scan session variable is enabled. |
| TabletCount | Number of tablets. |
| MorselsCount | Number of morsels, which is the basic IO execution unit. |
| PushdownPredicates | Number of pushdown predicates. |
| Predicates | Predicate expressions. |
| BytesRead | Size of data read. |
| CompressedBytesRead | Size of compressed data read from disk. |
| UncompressedBytesRead | Size of uncompressed data read from disk. |
| RowsRead | Number of rows read (after predicate filtering). |
| RawRowsRead | Number of raw rows read (before predicate filtering). |
| ReadPagesNum | Number of pages read. |
| CachedPagesNum | Number of cached pages. |
| ChunkBufferCapacity | Capacity of the Chunk Buffer. |
| DefaultChunkBufferCapacity | Default capacity of the Chunk Buffer. |
| PeakChunkBufferMemoryUsage | Peak memory usage of the Chunk Buffer. |
| PeakChunkBufferSize | Peak size of the Chunk Buffer. |
| PrepareChunkSourceTime | Time spent preparing the Chunk Source. |
| ScanTime | Cumulative scan time. Scan operations are completed in an asynchronous I/O thread pool. |
| IOTaskExecTime | Execution time of IO tasks. |
| IOTaskWaitTime | Waiting time from successful submission to scheduled execution of IO tasks. |
| SubmitTaskCount | Number of times IO tasks are submitted. |
| SubmitTaskTime | Time spent on task submission. |
| PeakIOTasks | Peak number of IO tasks. |
| PeakScanTaskQueueSize | Peak size of the IO task queue. |
Connector Scan Operator
It's similar to OLAP_SCAN operator but used for scan external tables like Iceberg/Hive/Hudi/Detal.
| Metric | Description |
|---|---|
| DataSourceType | Data source type, can be HiveDataSource, ESDataSource, and so on. |
| Table | Table name. |
| TabletCount | Number of tablets. |
| MorselsCount | Number of morsels. |
| Predicates | Predicate expression. |
| PredicatesPartition | Predicate expression applied to partitions. |
| SharedScan | Whether the enable_shared_scan Session variable is enabled. |
| ChunkBufferCapacity | Capacity of the Chunk Buffer. |
| DefaultChunkBufferCapacity | Default capacity of the Chunk Buffer. |
| PeakChunkBufferMemoryUsage | Peak memory usage of the Chunk Buffer. |
| PeakChunkBufferSize | Peak size of the Chunk Buffer. |
| PrepareChunkSourceTime | Time taken to prepare the Chunk Source. |
| ScanTime | Cumulative time for scanning. Scan operation is completed in the asynchronous I/O thread pool. |
| IOTaskExecTime | Execution time of I/O tasks. |
| IOTaskWaitTime | Waiting time from successful submission to scheduled execution of IO tasks. |
| SubmitTaskCount | Number of times IO tasks are submitted. |
| SubmitTaskTime | Time taken to submit tasks. |
| PeakIOTasks | Peak number of IO tasks. |
| PeakScanTaskQueueSize | Peak size of the IO task queue. |
Exchange Operator
Exchange Operator is responsible for transmitting data between BE nodes. There can be several kinds of exchange operations: GATHER/BROADCAST/SHUFFLE.
Typical scenarios that can make Exchange Operator the bottleneck of a query:
- Broadcast Join: This is a suitable method for a small table. However, in exceptional cases when the optimizer chooses a suboptimal query plan, it can lead to a significant increase in network bandwidth.
- Shuffle Aggregation/Join: Shuffling a large table can result in a significant increase in network bandwidth.
Exchange Sink Operator
| Metric | Description |
|---|---|
| ChannelNum | Number of channels. Generally, the number of channels is equal to the number of receivers. |
| DestFragments | List of destination FragmentInstance IDs. |
| DestID | Destination node ID. |
| PartType | Data distribution mode, including: UNPARTITIONED, RANDOM, HASH_PARTITIONED, and BUCKET_SHUFFLE_HASH_PARTITIONED. |
| SerializeChunkTime | Time taken to serialize chunks. |
| SerializedBytes | Size of serialized data. |
| ShuffleChunkAppendCounter | Number of Chunk Append operations when PartType is HASH_PARTITIONED or BUCKET_SHUFFLE_HASH_PARTITIONED. |
| ShuffleChunkAppendTime | Time taken for Chunk Append operations when PartType is HASH_PARTITIONED or BUCKET_SHUFFLE_HASH_PARTITIONED. |
| ShuffleHashTime | Time taken to calculate hash when PartType is HASH_PARTITIONED or BUCKET_SHUFFLE_HASH_PARTITIONED. |
| RequestSent | Number of data packets sent. |
| RequestUnsent | Number of unsent data packets. This metric is non-zero when there is a short-circuit logic; otherwise, it is zero. |
| BytesSent | Size of sent data. |
| BytesUnsent | Size of unsent data. This metric is non-zero when there is a short-circuit logic; otherwise, it is zero. |
| BytesPassThrough | If the destination node is the current node, data will not be transmitted over the network, which is called passthrough data. This metric indicates the size of such passthrough data. Passthrough is controlled by enable_exchange_pass_through. |
| PassThroughBufferPeakMemoryUsage | Peak memory usage of the PassThrough Buffer. |
| CompressTime | Compression time. |
| CompressedBytes | Size of compressed data. |
| OverallThroughput | Throughput rate. |
| NetworkTime | Time taken for data packet transmission (excluding post-reception processing time). |
| NetworkBandwidth | Estimated network bandwidth. |
| WaitTime | Waiting time due to a full sender queue. |
| OverallTime | Total time for the entire transmission process, i.e., from sending the first data packet to confirming the correct reception of the last data packet. |
| RpcAvgTime | Average time for RPC. |
| RpcCount | Total number of RPCs. |
Exchange Source Operator
| Metric | Description |
|---|---|
| RequestReceived | Size of received data packets. |
| BytesReceived | Size of received data. |
| DecompressChunkTime | Time taken to decompress chunks. |
| DeserializeChunkTime | Time taken to deserialize chunks. |
| ClosureBlockCount | Number of blocked Closures. |
| ClosureBlockTime | Blocked time for Closures. |
| ReceiverProcessTotalTime | Total time taken for receiver-side processing. |
| WaitLockTime | Lock waiting time. |
Aggregate Operator
Metrics List
| Metric | Description |
|---|---|
GroupingKeys | GROUP BY columns. |
AggregateFunctions | Time taken for aggregate function calculations. |
AggComputeTime | Time for AggregateFunctions + Group By. |
ChunkBufferPeakMem | Peak memory usage of the Chunk Buffer. |
ChunkBufferPeakSize | Peak size of the Chunk Buffer. |
ExprComputeTime | Time for expression computation. |
ExprReleaseTime | Time for expression release. |
GetResultsTime | Time to extract aggregate results. |
HashTableSize | Size of the Hash Table. |
HashTableMemoryUsage | Memory size of the Hash Table. |
InputRowCount | Number of input rows. |
PassThroughRowCount | In Auto mode, the number of data rows processed in streaming mode after low aggregation leads to degradation to streaming mode. |
ResultAggAppendTime | Time taken to append aggregate result columns. |
ResultGroupByAppendTime | Time taken to append Group By columns. |
ResultIteratorTime | Time to iterate over the Hash Table. |
StreamingTime | Processing time in streaming mode. |
Join Operator
Metrics List
| Metric | Description |
|---|---|
DistributionMode | Distribution type, including: BROADCAST, PARTITIONED, COLOCATE, etc. |
JoinPredicates | Join predicates. |
JoinType | Join type. |
BuildBuckets | Number of buckets in the Hash Table. |
BuildKeysPerBucket | Number of keys per bucket in the Hash Table. |
BuildConjunctEvaluateTime | Time taken for conjunct evaluation during build phase. |
BuildHashTableTime | Time taken to build the Hash Table. |
ProbeConjunctEvaluateTime | Time taken for conjunct evaluation during probe phase. |
SearchHashTableTimer | Time taken to search the Hash Table. |
CopyRightTableChunkTime | Time taken to copy chunks from the right table. |
OutputBuildColumnTime | Time taken to output the column of build side. |
OutputProbeColumnTime | Time taken to output the column of probe side. |
HashTableMemoryUsage | Memory usage of the Hash Table. |
RuntimeFilterBuildTime | Time taken to build runtime filters. |
RuntimeFilterNum | Number of runtime filters. |
Window Function Operator
| Metric | Description |
|---|---|
ProcessMode | Execution mode, including two parts: the first part includes Materializing and Streaming; the second part includes Cumulative, RemovableCumulative, ByDefinition. |
ComputeTime | Time taken for window function calculations. |
PartitionKeys | Partition columns. |
AggregateFunctions | Aggregate functions. |
ColumnResizeTime | Time taken for column resizing. |
PartitionSearchTime | Time taken to search partition boundaries. |
PeerGroupSearchTime | Time taken to search Peer Group boundaries. Meaningful only when the window type is RANGE. |
PeakBufferedRows | Peak number of rows in the buffer. |
RemoveUnusedRowsCount | Number of times unused buffers are removed. |
RemoveUnusedTotalRows | Total number of rows removed from unused buffers. |
Sort Operator
| Metric | Description |
|---|---|
SortKeys | Sorting keys. |
SortType | Query result sorting method: full sorting or sorting the top N results. |
MaxBufferedBytes | Peak size of buffered data. |
MaxBufferedRows | Peak number of buffered rows. |
NumSortedRuns | Number of sorted runs. |
BuildingTime | Time taken to maintain internal data structures during sorting. |
MergingTime | Time taken to merge sorted runs during sorting. |
SortingTime | Time taken for sorting. |
OutputTime | Time taken to build the output sorted sequence. |
Merge Operator
| Metric | Description | Level |
|---|---|---|
Limit | Limit. | Primary |
Offset | Offset. | Primary |
StreamingBatchSize | Size of data processed per Merge operation when Merge is performed in Streaming mode | Primary |
LateMaterializationMaxBufferChunkNum | Maximum number of chunks in the buffer when late materialization is enabled. | Primary |
OverallStageCount | Total execution count of all stages. | Primary |
OverallStageTime | Total execution time for each stage. | Primary |
1-InitStageCount | Execution count of the Init stage. | Secondary |
2-PrepareStageCount | Execution count of the Prepare stage. | Secondary |
3-ProcessStageCount | Execution count of the Process stage. | Secondary |
4-SplitChunkStageCount | Execution count of the SplitChunk stage. | Secondary |
5-FetchChunkStageCount | Execution count of the FetchChunk stage. | Secondary |
6-PendingStageCount | Execution count of the Pending stage. | Secondary |
7-FinishedStageCount | Execution count of the Finished stage. | Secondary |
1-InitStageTime | Execution time for the Init stage. | Secondary |
2-PrepareStageTime | Execution time for the Prepare stage. | Secondary |
3-ProcessStageTime | Execution time for the Process stage. | Secondary |
4-SplitChunkStageTime | Time taken for the Split stage. | Secondary |
5-FetchChunkStageTime | Time taken for the Fetch stage. | Secondary |
6-PendingStageTime | Time taken for the Pending stage. | Secondary |
7-FinishedStageTime | Time taken for the Finished stage. | Secondary |
LateMaterializationGenerateOrdinalTime | Time taken for generating ordinal columns during late materialization. | Tertiary |
SortedRunProviderTime | Time taken to retrieve data from the provider during the Process stage. | Tertiary |
TableFunction Operator
| Metric | Description |
|---|---|
TableFunctionExecTime | Computation time for the Table Function. |
TableFunctionExecCount | Number of executions for the Table Function. |
Project Operator
Project Operator is responsible for performing SELECT <expr>. If there're some expensive expressions in the query, this operator can take significant time.
| Metric | Description |
|---|---|
ExprComputeTime | Computation time for expressions. |
CommonSubExprComputeTime | Computation time for common sub-expressions. |
LocalExchange Operator
| Metric | Description |
|---|---|
| Type | Type of Local Exchange, including: Passthrough, Partition, and Broadcast. |
ShuffleNum | Number of shuffles. This metric is only valid when Type is Partition. |
LocalExchangePeakMemoryUsage | Peak memory usage. |
LocalExchangePeakBufferSize | Peak size of the buffer. |
LocalExchangePeakBufferMemoryUsage | Peak memory usage of the buffer. |
LocalExchangePeakBufferChunkNum | Peak number of chunks in the buffer. |
LocalExchangePeakBufferRowNum | Peak number of rows in the buffer. |
LocalExchangePeakBufferBytes | Peak size of data in the buffer. |
LocalExchangePeakBufferChunkSize | Peak size of chunks in the buffer. |
LocalExchangePeakBufferChunkRowNum | Peak number of rows per chunk in the buffer. |
LocalExchangePeakBufferChunkBytes | Peak size of data per chunk in the buffer. |
OlapTableSink Operator
OlapTableSink Operator is responsible for performing the INSERT INTO <table> operation.
- An excessive difference between the Max and Min values of the
PushChunkNummetric ofOlapTableSinkindicates data skew in the upstream operators, which may lead to a bottleneck in loading performance. RpcClientSideTimeequalsRpcServerSideTimeplus network transmission time plus RPC framework processing time. If there is a significant difference betweenRpcClientSideTimeandRpcServerSideTime, consider enabling compression to reduce transmission time.
| Metric | Description |
|---|---|
IndexNum | Number of the synchronous materialized views created for the destination table. |
ReplicatedStorage | Whether Single Leader Replication is enabled. |
TxnID | ID of the loading transaction. |
RowsRead | Number of rows read from upstream operators. |
RowsFiltered | Number of rows filtered out due to inadequate data quality. |
RowsReturned | Number of rows written to the destination table. |
RpcClientSideTime | Total RPC time consumption for loading recorded by the client side. |
RpcServerSideTime | Total RPC time consumption for loading recorded by the server side. |
PrepareDataTime | Total time consumption for the data preparation phase, including data format conversion and data quality check. |
SendDataTime | Local time consumption for sending the data, including time for serializing and compressing data, and for submitting tasks to the sender queue. |
